My reason for writing this post is to encourage you to join Mendus research studies. It is free to take part and you can either participate in the existing research or suggest new ideas through the forums. This is your chance to get personally relevant answers to some niggling questions without having to wait years for university-based research to receive elusive funding.
From my experience so far, I have personal statistical analysis which indicate that riboflavin (Vitamin B2), iron, Vitamin B12, selenium and zinc help symptoms such as pain and when I have more fibre, calories and water I feel worse. This is really valuable information which gives me the opportunity to better control my symptoms through what I eat.
What is Mendus?
Mendus is an exciting new patient-led, Quantified Self style research project started by Joshua Grant. He is a neuroscientist who also has CFS and explains on the website that
“Typically, I find one or maybe two small scientific studies, with a very modest number of CFS patients as well as a bunch of people on various websites and support groups commenting about their experiences with the supplement… As a scientist, I’ve had to admit to myself that this is a rather inefficient and unproductive approach to figuring out whether a particular treatment works or not. To answer a question like that we need proper research, with lots of people. But research takes a lot of time, and money… or does it?… One of the aims of Mendus is use some [Quantified Self] tools, to simplify and guide this self quantification process and to help individuals get the most out of their experiments. Such self-experiments have enormous potential to reveal patterns that could ease the suffering of the individual, for example by revealing links between symptoms and aspects of lifestyle (see discussion of the Chronic Fatigue Syndrome Diet Study below). If these individual data sets were to be integrated across larger groups, which is what I envision happening at Mendus, the potential exists for important new discoveries!” Joshua Grant mendus.org/mission
I heard about Mendus through this Cort Johnson post. At the moment the studies are a CFS/ME/SEID Diet or D-ribose, a Fibromyalgia Diet Study and a comparison of Pernicious B12 Deficiency Anaemia. If you suggest new studies or communities Mendus will help with the research design and statistical analysis. I suspect that studies which are easy to do at home and don’t require expensive equipment will be better suited to this set-up, but I see there are plans for DNA testing.
I did the Diet Study for 5 weeks and I’m planning to go onto the D-ribose study once I’ve got over a pesky stomach bug.
Diet Study
“It’s highly unlikely that diet causes CFS/ME, yet it is very likely that diet influences CFS symptoms. What you eat is all your body has to work with, in its fight to maintain health. It would be unrealistic to expect to be cured in this study, but you may learn how to feel a whole lot better. Furthermore, you also get the support of our online community as well as our scientific expertise, statistical analysis and presentation of your results. Not bad for free.” (instructions)
The Diet Study combines food recording using the existing resource of Spark People and brief symptom recording on the website (see full instructions pdf). To be honest I found the food recording draining in the first week and with 20:20 hindsight I would have got used to Spark People for a few days first before committing to the study. You can add favourites and food groupings and copy meals, so unless you eat an incredibly varied diet, it gets a lot simpler as you go along. I found the Spark People app much easier to use than the website but the website contains more information. Just using Spark People was an education, as I realised I was fairly clueless about the relative nutrition and calories of different meals.
Interpreting Results
“It has been said that an education is what survives when a man has forgotten all he has been taught.”
B F Skinner
I no longer remember much content from my Psychology BSc, which had a relentless emphasis on experiments and scientific method, but what it has left me with are some skills to interpret research through the brainfog (that is when I can physically read which isn’t always possible due to acquired dyslexia symptoms). This skill is invaluable in ME which is a field where it seems like you have to find ideas yourself at the same time as being plagued with controversy, political camps and agendas.
I found the Mendus study a good illustration of some research basics which are useful to understand when reading other research. You don’t need any research knowledge to benefit from Mendus itself, as Josh will help you interpret your results. With the risk of sounding teachery I thought you might be interested in some musings on my personal results (if not I won’t know if you move onto a different post at this point!):
Chicken, Egg and Magnesium
The Diet Study’s method is observational which means that nothing is manipulated to measure cause and effect, you just keep eating what you normally eat. The statistics which you can see on the Results page are correlations, a basic form of statistical analysis that indicate whether there is a relationship between two things. You can see if A happens when B happens but you can’t know anything about if B causes A or if a completely different C causes both of them. On the graphs showing possible correlations an angled line in either direction indicates a correlation and the tighter the points hug the line then the more of a thing it is. A flat, horizontal line indicates that there isn’t a correlation (so no matter how many carrots rich in vitamin A I eat there is no relationship with my pain, and my level of pain has no relationship with how many carrots I decide to eat):
EXAMPLE GRAPHS OF NO CORRELATION VS CORRELATION:

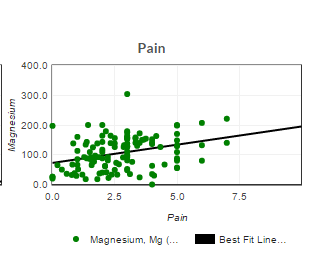
A surprising finding of the study so far is that higher magnesium intake is associated with greater pain. This is intriguing and requires further thought or investigation.
After my second week my correlation between magnesium and pain was 0.82. This is unusually high and unexpected (to put it in context, if the correlation was 1 that would mean that my pain would always increase/decrease in proportion to how much magnesium I had and 0.82 is quite close to 1). It is odd as I take magnesium supplements because I’ve been led to understand they decrease pain and help sleep.
It would be easy to see these results and assume that magnesium is causing me pain. However, this is an observational study and the correlation doesn’t say anything about what causes what. I realised that because of my belief/attitude about the benefits of magnesium this was likely to cause the behaviour of taking magnesium when I was in greater pain or having a symptom flare. In other words, did pain lead to taking magnesium supplements not the other way around?
Although this wasn’t a manipulated experiment, so ideally I should have carried on my diet as normal, I decided not to take magnesium when my pain increased. Within a week the correlation dropped to 0.47 and so the two weeks after that I stopped magnesium supplements altogether and the overall association with pain wasn’t even significant anymore (in statistics this is a specific cut off which indicates whether a relationship is likely to be due to chance, so by the end of the study any relationship between my pain and magnesium was likely to be down to chance). This may not be the reason for the group effect though, other reasons may include kidney problems or reacting to additives within the supplement, but it seems to have cleared the issue up for me. My initial conclusion was to no longer wasting money on magnesium supplements that don’t work for me.
Update 20th June:
To clarify the magnesium situation Josh has done extra analysis (a t test) which asks the question “what are the differences between the first two weeks and the last two weeks of Jenny’s diet study?” The results are
The correlation between magnesium and pain went from 0.82 to -0.36.Nutrients and symptoms which were altered significantly were: Less Vitamin C, More Iron, Less Folate, Less Magnesium, Less Pantothenic acid – Vitamin B5, More Energy, More Clarity.
Pain did drop but it was not significant.
The difference in my behaviour in these two time periods was that I stopped taking supplements containing magnesium (there was still a reasonable amount of magnesium from food but I wasn’t aware of this fluctuation).
It seems reasonably safe then to say that the swing from 0.82 (more pain with more magnesium) to -0.36 (less pain with more magnesium) could be the difference when you get rid of my decision making for taking magnesium. This is quite a swing. Would painkiller popping show something similar?
What does it mean for my practical decision making process of whether or not to take magnesium supplements?
One of the things that this comparison also (inadvertently) does is compare naturally occurring magnesium in food with supplements (so I could be reacting to something in the supplements). It maybe that my pain is reduced just with food magnesium (but -0.36 isn’t a significant reduction in pain, for just 2 weeks of data it would need to be +/-0.53).
Another, explanation is that there’s an optimal amount of magnesium for me to take, so actually it should be a U shaped curve on a graph. If you look at this graph showing the association between Magnesium and Pain in the first two weeks and last two weeks you can see that the crossover pain point is pretty close to 100% recommended daily allowance, which is possibly not a coincidence:

1st 2 weeks vs last 2 weeks Association between Magnesium and Pain
Perhaps it would be worth investigating this further at some point with more data but for now I think my most sensible response is to aim for just over 100% RDA magnesium but mainly through food.
Face Validity
Robust scientific research is reliable (repeatable, standardised) and valid (measures what it says it measures). Something that most people can spot is Face Validity, which is when just by glancing at the results you can tell whether they seem to be measuring what they say they’re measuring (e.g. what is your gut reaction to results showing Graded Exercise had better outcomes than Pacing and didn’t lead to adverse outcomes?!). Examples of my Mendus results which have some face validity are that Vitamin B2, iron and B12 are associated with less pain (even with more complex statistics which control for variations related to daily activity and sleep these were unlikely to be down to chance). B12 deficiency mimics many symptoms of ME (see also this article on B12 injections and ME). Riboflavin or B2 is involved in muscle mitochondria stuff a hot area of ME research so that has some Face Validity without me needing to fully understanding the mechanisms involved. B2 deficiency is known to reduce iron utilisation (more face validity). For example, it may be that enough B2 helps me process Iron, and it is the sufficient Iron that prevents leg cramps and headaches. Is it a greater effect on days when I get lots of B2, B12 and Iron together?
These Infographics from Harmony with PCOS illustrate the benefits of these nutrients:


NB there’s a typo in this Infographic. B12 recommendations vary but they’re in mcg not mg eg 1.5-2.4mcg.

On the other hand, I had a statistically significant result showing that Vitamin C is related to fewer sleep hours. It has no Face Validity to say that Vitamin C causes less sleep, from what I know of Vitamin C. Josh commented that this measure was a slight flaw because the sleep measure was being synced by the current day (meaning it measures the night before you’ve eaten). He commented that the only possible causality would be that the fewer hours sleep I had then the more Vitamin C I ate the next day. I realised that, similar to the magnesium issue, this is in fact what I do. I don’t take strong supplements everyday instead I have a pattern of reactive supplement consumption: I’m having a bad day so I cram in as many things as possible that may make me feel less crap. This result was meaningless in terms of working out how my diet effects my symptoms, but it was a bit of an eye opener in terms of my illness behaviour.
Using Results
By week 4 a number of my correlations were significant, more than I’d expected, and some of them lacked Face Validity. Josh put these through better stats which also removed effects from how much activity I’d had and how well I’d slept (in ME we’d expect these to be major influencers on how we feel, probably more than the effect of diet). Fewer results were significant but these results generally made more sense than the plain correlations.
With this information, I looked at what I’d eaten through my Spark People data and identified the things I should eat more and less of (this will be very personal):
| Eat more: | ||||
| B2 Riboflavin =Down pain | Iron =Down pain | Selenium =Up clarity | Zinc=Up energy and clarity | B12 =Down pain |
| goat cheese | Spring greens | smoked salmon | Zinc tablet | Milk |
| chicken breast | Basmati rice | Poached egg | Pumpkin Seeds | |
| coffee | Potato | Mushrooms | Chicken thigh/breast | Smoked Salmon |
| Poached egg | Quinoa | Chicken thigh/breast | Beef | Pork |
| Feta | Mushrooms | Poached egg | ||
| Mushrooms | Sundried tomatoes | Pork | Beef | |
| Sundried tomatoes | Chicken | |||
| Sweet potato | ||||
| Eat cautiously: | ||||
| High Fibre=less energy | High calory=up pain (though whole day that matters so specific food maybe irrelevant) | High fat=trend for down energy and clarity but not significant | ||
| Potato | Lamb Kofta | Steak – also good | ||
| Broccoli | Chicken breast – also good | Lamb mince | ||
| Quinoa | Pork – also good | Beef mince – also good | ||
| Almond Flour | Salmon – also good | Coconut oil | ||
| Sweet corn | Penne pasta | Pork – also good | ||
| Sweetpotato | Bacon – also good | |||
| Saag paneer | Fish pie? – also good | |||
| Lamb kofta | Almond flour | |||
| O’s cereal | Almonds | |||
| Pine nuts | ||||
| Butter | ||||
Planning Meals
The beauty of this is that I have information based on what I already eat, rather than obscure ingredients I’ve never heard of. My next step is to adjust my supplements a bit and think of meals and food combinations which maximise the good and minimise the troublesome. Using my Spark People information I can see that smoked salmon and poached egg breakfast, goat cheese on sundried tomato toast for lunch, chicken and spinach curry dinner, a smoothie and some supplements is a good food day for my nutritional needs.
We Have the Power!
Join in, data is considered more powerful if there’s more of it. If you join in with the Diet Study it will be become slightly more powerful than it is today in representing genuine effects in the ME/fibromyalgia population. If you do it for 6 weeks rather than 2 weeks it is more likely to genuinely show your symptom relationship with diet (rather than risking missing a real effect or showing an effect which is really down to chance).
An analogy to understand statistical power You send your child into the basement to find a tool. He comes back and says “it isn’t there”. What do you conclude? Is the tool there or not? There is no way to be sure.So let’s express the answer as a probability. The question you really want to answer is: “What is the probability that the tool is in the basement”? But that question can’t really be answered without knowing the prior probability… We’ll pass on that, and instead ask a slightly different question: “If the tool really is in the basement, what is the chance your child would have found it”?… The time searching the basement is analogous to sample size. If you collect more data you have a higher power to find an effect.

Reblogged this on SandlapperDreams.
LikeLike
This is interesting, I’ll take a look at the site. I particularly find it interesting what you say about magnesium. I actually fully believe it made me worse and I experienced a lot of face flushing (I wasn’t taking niacin or anything that was known to do that)
Although, like you I started taking it because joint pain started so it could have been that I’m blaming it for worsening symptoms when actually I just happened to be taking it when my body did that on its own.
I do a lot of self experimentation so it’s s good idea to use that effort and data to put into something like this. Thanks for the blog
LikeLiked by 1 person
It is intriguing. When I’ve asked people for Tips-for-ME (See the Tips page) magnesium is possibly top of the list as a recommendation. I’ll do a quick tally to check that actually
LikeLike
Looking at supplement style tips written to @TweetTipsforME, recommendations for magnesium =6, recommendations for all other supplements put together =6. General diet tips seem more popular though I didn’t count these (eg gluten free, anti-candida, low GI). Mendus could also look into general diets eg Low Fodmap.
LikeLike
I think we need to be careful here though. If in fact you’re taking magnesium because you’re in pain, yes, that might explain the counter-intuitive correlation but that doesn’t mean the magnesium isn’t working. It could be that your pain would have been twice as bad if you didn’t take the magnesium. You’ve shown that not taking in the magnesium when you have pain can reduce the correlation. That’s clear. But we still don’t know what happened to your pain. To answer that you would need to statistically compare the amount of pain before and after your decision to stop taking it when you feel pain. Let me know the dates and I’ll see if I can get you an answer.
LikeLike
I think it’s pretty cool!
Josh 🙂
LikeLiked by 1 person
I suppose painkillers like paracetamol would show what you’re describing: the strength of the correlation with taking them and being in pain would be stronger than the reduction in pain from taking them, but that doesn’t mean that they don’t work.
28th May is the day I stopped taking magnesium supplements. There’s a day of particularly high magnesium after that but I double checked and it’s from food (mainly chia seeds).
It is a little bit less clear than a 28th may cut off though as after the 2nd week I became aware that I was going taking supplements because I felt worse. It may be better to compare first two weeks (4-17th May) with the last two weeks (25th May-7th June).
LikeLike
Pingback: Resource: insomnia, what works best? Sleep 4 | Tips for ME
Pingback: Unknowing-Knowing: Epistemological Crisis in ME | Tips for ME
Pingback: Resource: Walking Problems | Tips for ME
Pingback: Review: Can Post-Exertional Malaise make a Placebo Effect seem like a Nocebo? | Tips for ME
Pingback: Review: Rejuvenation Lotion | Tips for ME
Pingback: Blog Anniversary: 4 year recap | Tips for ME